
 In photogravure on copperplate, etching is commonly done by immersing the plate in several solutions of ferric chloride of different concentration. As the pigmented gelatin is thicker where the image tone is higher, the trick is to allow the ferric chloride to penetrate beginning by the thin gelatin in the shadow areas and progressively do the same up to the highlights. It is usual to put a grey scale step wedge aside the image on the same plate. This serves to control the etching progress. General advise is to change the plate to a more diluted ferric chloride solution when it is no more apparent etching. In an ideal situation, the plate will show equal etched steps for more or less equal periods of time. This supposes that the copper etching is constant once the ferric chloride had passed through the corresponding gelatin thickness. For a given carbon tissue, there is also a recommended group of ferric chloride dilutions that will perform a correct etching.
But, what is a correct etching? If the goal is to achieve a complete tone scale, as usually is, the answer implies that what we want to complete is an etching inversely proportional in depth to the tone in the image. The low (darker) the tone, the more deep the etching. This ensures a high charge of ink for the shadows and smaller quantities for the highlights. Additionally, a correct etching should provide the darkest and deeper black avoiding open bite caused by lateral etching. This determines a maximum total etching time. It must be previously determined using the same screen that will be used with the actual images. Once the maximum etching time is found, there is also necessary to find which is the first dilution of ferric chloride concentration capable to penetrate the shadows in a reasonable time (usually 2min) and the last dilution that preserves the white highlights. The departures of those indications would be corrected changing the positive density scale and/or the respective screen and positive exposure times. Following the instruction sheet of the Dragon Gravure tissue from Cape Fear Press, this would be accomplished by a sequence from 45ºBé to 40ºBé.
In practice and even following all above recommendations, the results are not always the expected. Even with a deep and rich black without open bite and a clean and brilliant white, the final aspect of the print can show a certain departure from the original image. It is common that, even with those correct ends of tonal scale, the relationship between the steps of the medium grey values is different of those of the step wedge. Another common problem is that following the etching progression by visual inspection, it is difficult to observe the previously determined total etching time without risk of over etching the highlights. Attending to those difficulties and looking for a better controlled etching procedure, there are some questions that must be taken into account.
From a text published by H. M. Cartwright in 1961 (1), it can be derived that the etching action of the ferric chloride is highly dependent of its concentration. This indicates that the concentration not only determines its ability to penetrate the gelatin resist, but also acts with a different speed when finally is in contact with the copper. The Fig., 1 shows a plot taken from this text representing the depth achieved by several ferric chloride dilutions on a copper plate for a given time.
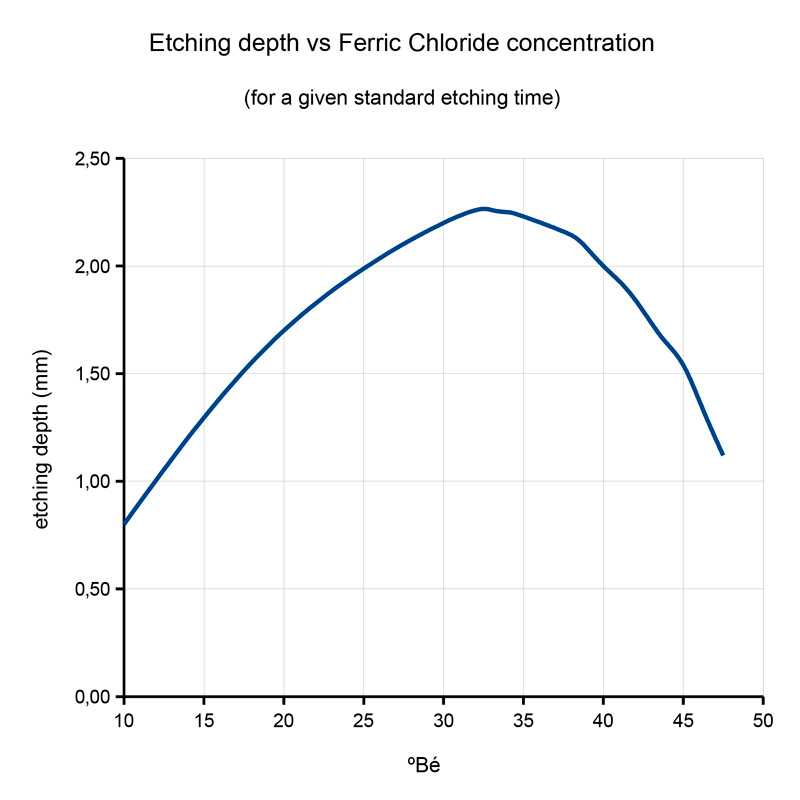
As can be observed, the etching power of the ferric chloride on copper rises up as a function of the concentration. This occurs up to 33ºBé approximately, from where the activity goes backwards decreasing again. If we take a portion of this plot, that corresponding to the concentrations between 39ºBé and 45ºBé (Fig., 2), we can realize that is almost linear. In addition to its capability of resist penetration using gelatinized paper, this is a good reason for the use of a group of dilutions highly recommended in many texts.
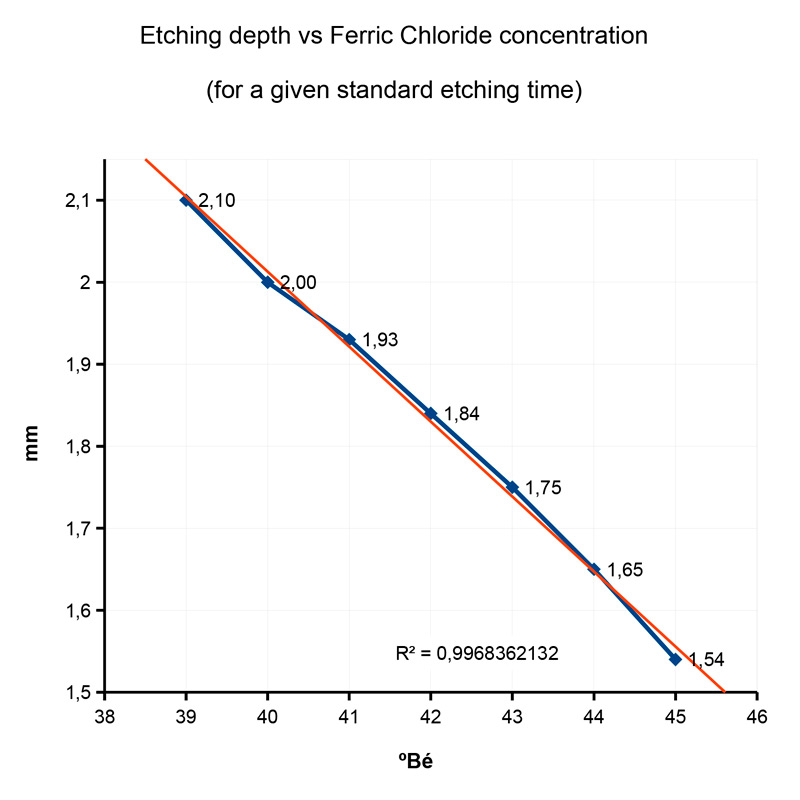
In spite of this linearity, the figures in the depth units indicate that the activity of a 45ºBé solution is of only the 73% than that of 39ºBé. This suggest that if we want to progress a constant depth into the copper along the total etching time, the plate must remain more time in the concentrated solutions but less when it is immersed in the more diluted. Following this hypothesis and for a given total etching time, it can be divided in as many parts as dilutions will be used. The weighted individual time for each is derived in turn from the activity shown in the plot of the Fig., 2.
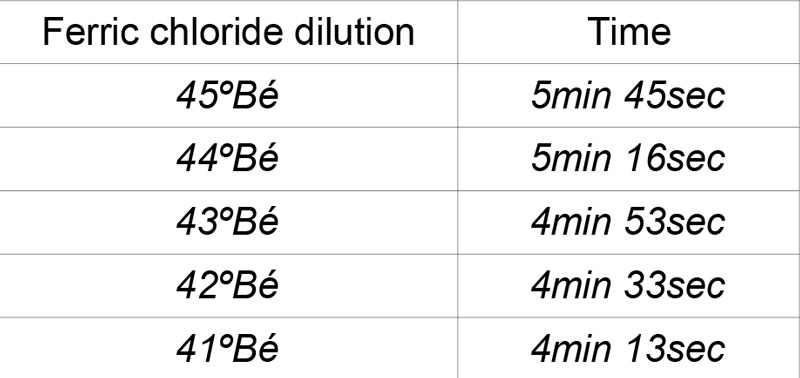
As an example, we suppose that our total etching time producing a rich black is 25min and the dilution that penetrates the shadows resist is 45ºBé. Following with the example, the last dilution that still avoid an over etching of the white patch in the step wedge is 41ºBé. A weighted etching sequence derived from the upper plot is shown in the Table 1.
There are still two more questions that might be taken into account. The first, related with the influence of the temperature in the etching progression. The second, the swelling of the resist and the subsequent ferric chloride penetration. The influence of temperature can be derived from a graph in the same Cartwright (1) text cited above (Fig., 3). The paragraph says textually that “There is a practically straight-line relationship between temperature and the rate of etching, at least within the ordinary working range… Depth increases about 2% per ºF rise” (≈0.66% per ºC).
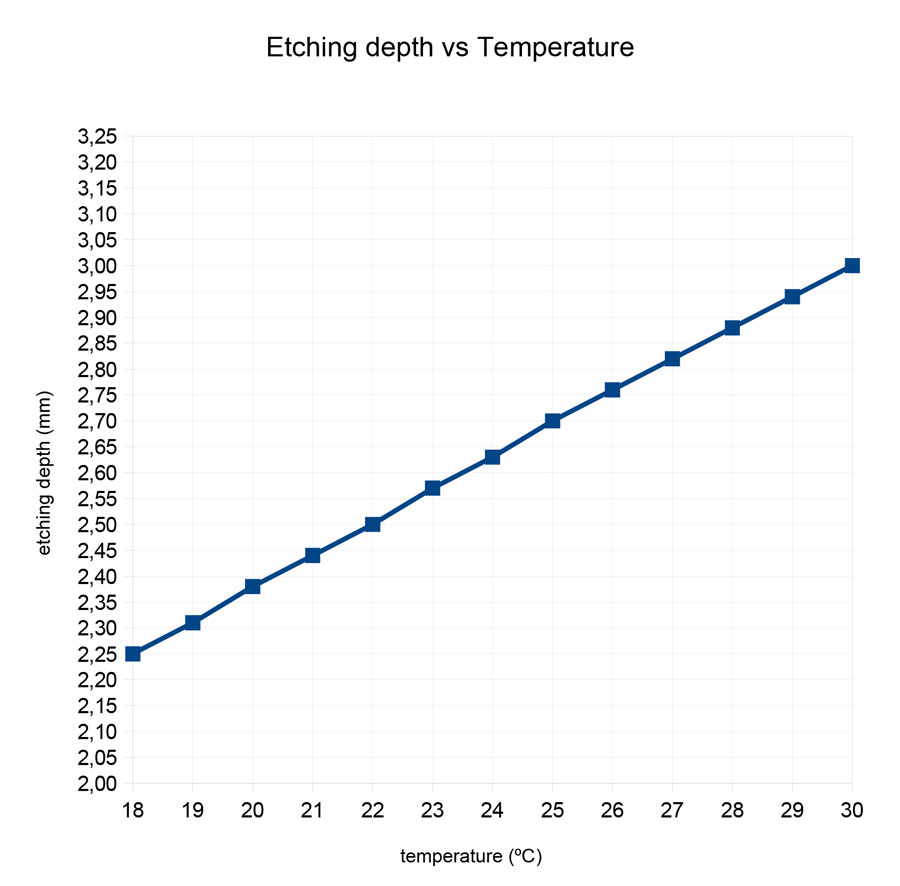
The same text explains that although a higher temperature improves the uniformity of results, around 90ºF (32ºC), the ferric chloride tends to weaken the resist. In my own experience and using stochastic screen, this occurs before, around 26 – 27ºC. Probably the strength of the resist of hardened gelatine is different as a function of a given carbon tissue, that in turn depends mainly from the wavelength of the UV light source output. If the resist weakens, the highlights are quickly over-etched. In any case, maintaining the ferric chloride solutions temperature as a constant, say to 21ºC, is very important in order to control the etching sequence and how it affects to the tone scale. If this is not possible, the actual temperature should be read and the general scheme correspondingly modified. The total penetration depth achieved, is responsible for the correct black density and, if exceeded, risks the apparition of open bite.
Conversely to this linear behaviour, when the plate is immersed in the ferric chloride baths the swelling of the resist is not linear at all. Justifying the need of more than one ferric chloride bath, the same Cartwright explains in a text of 1930 (2): “It is assumed that, when a solution of a salt such as ferric chloride is applied, two separable processes take place. The first of these is the swelling of the gelatine, which goes to a maximum and then the diffusion of the ferric chloride solution begins. The maximum swelling is not proportional to the time, but is rapid at first and then slows down as the maximum is approached”.
If all those interlaced relationships between the resist hardness, the resist swelling, the ferric chloride penetration and the etching depth on copper were linear in response, it would be possible to etch a plate with a unique solution of ferric chloride. It is important do not forget that the goal, beyond a rich black and a clean white, is a linear grey scale in between. Probably because of my reduced experience, I have found that this necessary linearity can be hardly achieved only by visual inspection over an step wedge. Scanning the printed results for an step wedge, shows that the visual inspection drives each time to a different results with only a common characteristic, the lack for a linear response. Wondering about that, it seems to me that a simplified method would be more effective if the above given non-linearities are come into play. Since a video of Fanny Boucher (3) and after an email dialogue with Jon Goodman (4), I have noticed that both are using only two ferric chloride solutions. Then, I have decided to try with this procedure and take into account the early explained causes of non-linearity.
The sequence of steps for testing the suggested etching method is as follows:
- Exposing a tissue sequentially to the digital screen and then to a black transparency printed with the usual settings in the inkjet printer, is useful to determine the minimum exposure times that produces as thin as possible resist layer. The thickness of the resist is better seen transferring the gelatine on a transparent glass with the same method used with copperplates (5). A transmission densitometer reading or a digital image reproduction both with camera or scanner, can help to distinguish this thin resist layer from the glass background.
- Once this minimum exposure times are determined, what is necessary now is to find out which is the etching time that produces a rich black without open bite risk. This is done preserving strips of the copperplate with packaging tape during the etching with a very diluted ferric chloride solution, that is to say, 39 – 40ºBé.
- Take, for instance, four correctly exposed tissues using the digital screen and a step wedge printed with the same method that will be used with actual images and transfer them on an equal number of copperplates.
- Prepare four ferric chloride baths of decreasing concentration. That is to say, for example, 45º – 44º – 43º and 42ºBé.
- Following with the previous example, consider four couples of baths, (45º – 44ºBé), (44º – 43ºBé), (43º – 42ºBé) and (42º – 41ºBé). Taking the total etching time previously determined and the values shown in the Fig., 2, it is possible to calculate how many time the plate must be etched in each bath for each couple of baths.
- Etch the four plates following this schemes and print it with the usual inking, wiping, paper and press.
- Scan on and measure the grey value of the step wedge patches. Plot a graph that shows the tonal range progression. The goal is an as straight as possible line.
- Take the best result in terms of linearity and fine tune the grey scale applying a Correction Curve to the test target image in Adobe Photoshop or any other digital image processing software.
The Fig., 4 shows the linearity of grey tone scale achieved (in red) after to apply a Photoshop correction curve to the best result in the previous assay (in blue).

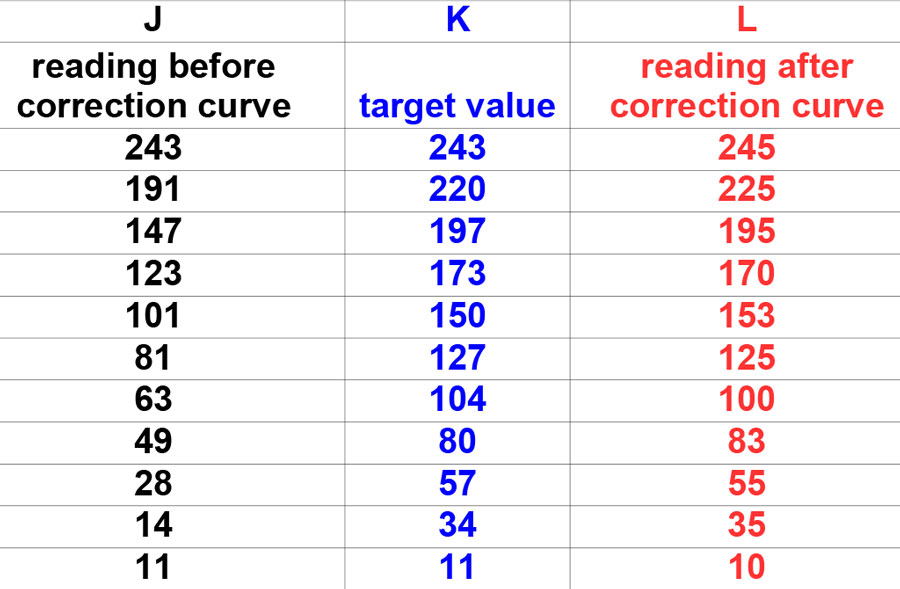
The Photoshop correction curve follows from the actual reading values for each step in the printed target. In order to calculate the necessary correction, we can use an spread sheet and create a column with the actual read values in a column (J in Fig., 5) and then use an equation to calculate the corresponding target values (column K in Fig., 5). If we take the example of the calculated target value 220, it is the result to apply the equation =K3-((J$3-J$13)/10) in the cell of the spreadsheet. The procedure to plot the correcting curve can be done in Adobe Photoshop setting the actual and target values in the correspondingly input and output windows of the Curves Tool. This correction curve can be saved with the available commands in Adobe Photoshop and then, applied to all images to be printed as positive transparencies.
From the comparison between the two plots in the Fig., 4 it can be derived that although both show correct shadows and lights endings, the progression of the intermediate grey scale is linear only in the graph obtained from the corrected positive transparency of the test target. In this way, we can not only simplify the etching step, but also preserve the image visual appearance as we have edited it in the computer screen. A bit closer to a WYSIWYG system.
REFERENCES
- CARTWRIGHT, H. M. (1961) ILFORD GRAPHIC ARTS MANUAL Volume 1 Photoengraving. Ed. Ilford Limited, Ilford, Essex.
- CARTWRIGHT, H. M. (1939) PHOTOGRAVURE A Text Book on the Machine and Hand Printed Processes. Ed. American Photographic Publishing Co., Boston.
- FANNY BOUCHER Héliograveur (2013) Réalisation d’une Héliogravure du photographe Georges Saillard. On line https://www.youtube.com/watch?v=FsRZcEVCXAI. Last visit: July 12th 2016.
- GOODMAN, Jon. Jon Goodman * Photogravure. On line: http://jgoodgravure.com/index.html. Last visit: July 12th 2016.
- MORRISH, David & MacCALLUM, Marlene (2013) Copper Plate Photogravure, Demystifying the Process. Ed. Focal Press, New York/London.

Be Carles, suposo que has escrit el article directament amb angles, jo no tinc un domini del idioma tant gran, i per tant he tingut que utilitzar el traductor, fas una descripció del “Carles Mitjà System”, molt sintètic, concretant en els aspectes que quedaven mes obscurs del procediment. Finalment sembla que has batejat el sistema ? WYSIWYG SYSTEM? Salud
:47:25 +0000 To: xavidea@hotmail.com
LikeLike